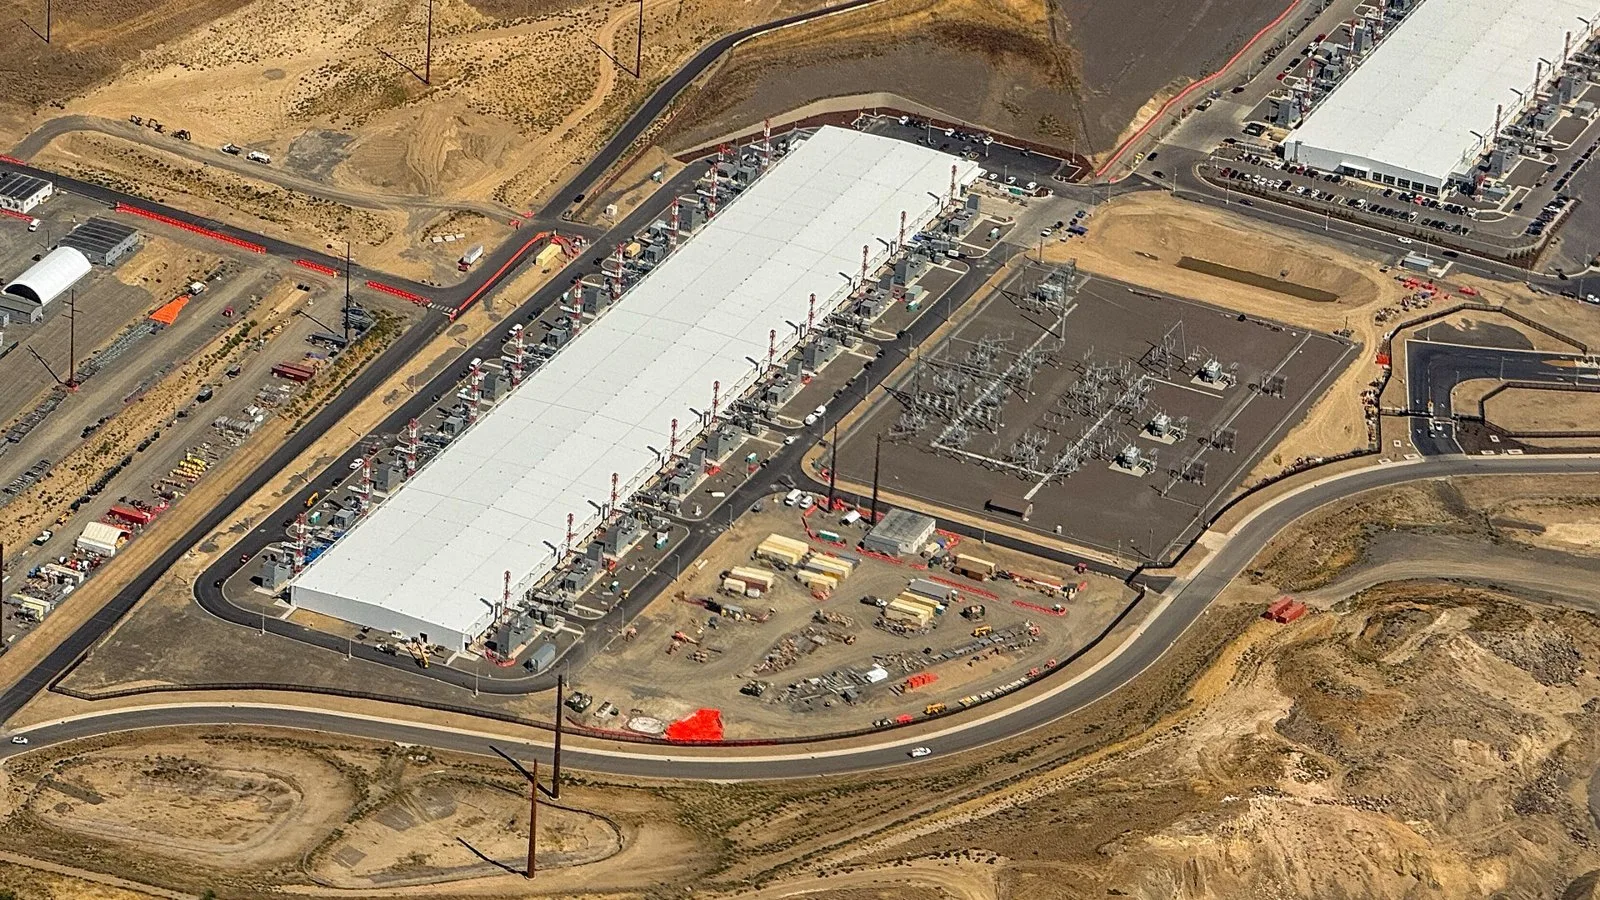
Microsoft spent $115.9bn on property and equipment in the twelve months to 30 June 2026, and the market’s opinion of that number reversed twice inside six months. On 29 January the shares fell 9.99% in a session as capital expenditure was read as a margin problem. On 30 July they rose 15.51% — the largest single-day gain in years for a company this size — as the same spending was read as an investment thesis. Nothing about the cash outflow changed between those two days. What changed was the evidence of return. MSFT closed at $495.40 on 14 August 2026, still 8.6% below its October 2025 peak close and down 5.2% over twelve months, despite fiscal 2026 revenue rising 18% to $331.8bn and operating income rising 21% to $155.2bn. This is a stock where the argument is entirely about one line in the cash flow statement.
The number that reframes the debate is not the capex figure at all. It is the backlog. Microsoft’s commercial remaining performance obligation — contracted revenue not yet recognised — rose 84% to $678bn in fiscal 2026. That is roughly 2.0 times the company’s entire annual revenue, already signed. Set against $115.9bn of annual capex, the ratio matters more than the absolute: the company is not spending into hope, it is spending against a contracted order book that grew four times faster than revenue did. The bear case has to argue that the backlog converts more slowly, at worse margins, or later than the depreciation schedule assumes. That is a real argument, and the 10-K itself supplies its best evidence.
Key facts
- FY2026 revenue: $331.8bn, up 18%; operating income $155.2bn, up 21% — (Microsoft Form 10-K, filed 29 July 2026)
- GAAP diluted EPS $17.95, up 32%; adjusted diluted EPS $17.28, up 22% — (Form 10-K)
- Capex: $115.9bn, against $64.6bn in FY2025 and $44.5bn in FY2024 — up 79.6% in a year and 2.6× in two — (Form 10-K cash flow statement)
- Commercial RPO up 84% to $678bn — about 2.0× annual revenue — (Form 10-K)
- Azure and other cloud services revenue up 41% for the year, and 43% in the June quarter, its fastest since early 2022 — (Form 10-K; Q4 FY2026 results, 29 July 2026)
- Microsoft Cloud gross margin fell to 66%, which the company attributes to AI infrastructure investment — (Form 10-K)
- Cash and short-term investments fell to $76.8bn from $94.6bn a year earlier — (Form 10-K)
- Spot: $495.40 at the 14 August 2026 close; 52-week range $349.20–$553.72 — (daily closes, stockanalysis.com)
The two days that defined the year
Microsoft’s twelve-month chart is not a trend. It is a cliff, a trough and a vertical recovery, and each segment has a specific cause.
The shares peaked at a $542.07 close on 28 October 2025. The decline that followed accelerated on 29 January 2026, when the stock fell 9.99% to $433.50, and continued through a 4.95% drop on 5 February to $393.67. The market’s concern in that window was straightforward: capital expenditure was scaling faster than the revenue attributable to it, cloud gross margin was compressing, and the depreciation from those assets would arrive on the income statement whether or not AI demand did. The shares bottomed at a $352.83 close in the spring — roughly 35% below the October peak.
Then came 30 July 2026. Fourth-quarter revenue of $90.01bn rose 18%, adjusted EPS of $4.74 rose 23%, and Azure grew 43% — beating the roughly 40% consensus and marking the fastest quarterly growth since early 2022. Azure’s annualised revenue crossed $100bn for the first time. Critically, quarterly capex came in at about $41bn against roughly $42bn expected, and free cash flow beat consensus by 46%. The stock rose 15.51% from $390.54 to $451.10 and has added a further 10% since.
The lesson traders took from that sequence is worth stating precisely, because it defines what to watch next. The market never objected to the spending in principle. It objected to spending without a visible, accelerating return. When Azure accelerated and capex came in slightly under plan and free cash flow beat, all three objections resolved at once. That is why the reaction was violent rather than incremental. Our coverage on the day, Microsoft’s capex rewarded while Meta’s was punished, set out how differently the market treated two very similar spending programmes in the same week.
What the fiscal 2026 accounts actually show
Full-year results were strong on every operating line, with one caveat that cuts against the headline.
| Fiscal 2026 | Amount | Change |
|---|---|---|
| Revenue | $331.8bn | +18% |
| Gross margin | $225.5bn | +16% |
| Operating income | $155.2bn | +21% |
| GAAP net income | $133.7bn | +31% |
| GAAP diluted EPS | $17.95 | +32% |
| Adjusted diluted EPS | $17.28 | +22% |
| Capital expenditure | $115.9bn | +79.6% |
Note the relationship between the two earnings lines. GAAP net income grew 31% while adjusted net income grew 22%, and GAAP EPS grew 32% against adjusted EPS growth of 22%. The gap runs in the unusual direction: the reported figure is higher than the adjusted one, because Microsoft’s non-GAAP measure strips out net gains from investments. In a year when equity and other investments rose from $15.4bn to $36.3bn, those gains were substantial. The honest read is that $17.28, not $17.95, is the number to build a multiple on — and that the 22% growth rate, not 32%, is the underlying one.
Gross margin percentage slipped: gross profit grew 16% against revenue growth of 18%, and Microsoft Cloud gross margin specifically fell to 66%, which the filing attributes to AI infrastructure investment and rising AI product usage, partly offset by efficiency gains in Azure and Microsoft 365. This is the mechanical cost of the buildout showing up exactly where you would expect it, and it is why margin, not revenue, is the line the bears watch.
The scale underneath those percentages is easy to lose. Microsoft Cloud revenue rose 27% to $214.4bn in fiscal 2026 — a single reporting line larger than all but a handful of companies in the S&P 500. Azure sits inside it and grew 41% for the year, which means the fastest-growing component is also one of the largest. Growth of that order at that base is the reason the market tolerates a premium multiple at all, and it is why a deceleration of five percentage points in Azure matters more to the share price than almost anything else the company reports.
One cash-flow detail deserves more attention than it has received. Cash used in investing rose $66.9bn to $139.5bn, and the filing attributes that net increase principally to two things: a $51.4bn rise in additions to property and equipment, and a further $22.2bn rise in other investing activity “primarily to facilitate the purchase of components,” partly offset by lower spending on acquisitions and other items. Microsoft is committing cash to secure physical supply, not only to build shells. That is a rational response to a constrained market for accelerators and memory, and it is also a second, less visible call on the balance sheet that does not appear in the headline capex number most commentary quotes.
At $495.40 against adjusted EPS of $17.28, Microsoft trades on about 28.7 times trailing adjusted earnings, with a market capitalisation near $3.68trn on 7.43bn shares outstanding. The dividend, at $3.64 declared per share, yields about 0.7% — this is not a stock anyone owns for income. Buybacks continued through the buildout rather than pausing for it: the company repurchased 36 million shares in fiscal 2026, up from 31 million in fiscal 2025.
The capex tension, in Microsoft’s own words
The most useful sentence for a bear is not in any analyst note. It is in Microsoft’s own risk factors, where the company describes its AI buildout as being made “at significant scale and on an accelerated timeline,” requiring “substantial and increasing capital expenditures and continued access to capital,” and — the key clause — being made “in advance of fully developed revenue streams.”
That is the company stating plainly that the spending precedes the revenue. It is a fair and standard disclosure rather than a warning, but it defines the risk precisely: assets bought today are depreciated over a fixed schedule regardless of how quickly the $678bn backlog converts. If conversion runs behind depreciation, operating margin compresses even while revenue grows. Cash and short-term investments already fell $17.8bn to $76.8bn over the year, and cash used in investing rose $66.9bn to $139.5bn.
The counterweight is that Microsoft is funding this from operations while still returning capital — it repurchased 36 million shares during the year and declared $3.64 a share in dividends, with total stockholders’ equity ending at $442.4bn. This is not a balance sheet under strain. It is a balance sheet being deliberately redeployed, and the same tension is playing out across the hyperscalers, as our analysis of Amazon raising capex to $220bn and still beating expectations shows.
One further consideration that has faded from the narrative but has not disappeared: Microsoft’s quantum computing programme. It contributed to sentiment in early 2026 and remains genuine long-dated optionality, but it produces no revenue today and should carry no weight in a twelve-month price target. Treat it as a free option, not a line in the model.
The $640 bull case and the $380 bear case
The bull case to $640 (+29.2%). This requires Azure to hold growth near 40% through fiscal 2027 while capex growth decelerates from 79.6% toward something closer to 25–30%. That combination — revenue growth sustained, spending growth slowing — is what produces operating leverage, and it is exactly the combination the 30 July print delivered for one quarter. On roughly $20.75 of fiscal 2027 adjusted EPS, which assumes 20% growth from $17.28, $640 is about 31 times forward earnings. That is a premium multiple, but Microsoft has traded there before with slower Azure growth and a far smaller backlog. Consensus sits at $569.56 across 56 analysts, with Citi, Morgan Stanley and UBS all endorsing $600; $640 is above the average but well inside the $870 street high.
The bear case to $380 (−23.3%). This does not require an AI winter. It requires only that the $678bn backlog converts more slowly than the depreciation schedule on $115.9bn of annual capex assumes. In that scenario cloud gross margin drifts below 66%, adjusted EPS growth decelerates from 22% toward low double digits, and a 28.7 multiple is no longer defensible on a low-teens grower. Roughly 22 times $17.28 gives $380. That level would revisit the spring lows and sit below the lowest published analyst target of $400 — worth stating plainly, because no analyst currently models it and the sell side carries zero Sell ratings on the stock.
The signal that resolves this is narrow and dated. It is the Azure growth rate alongside quarterly capex in the next two reports. Azure above 38% with capex growth decelerating validates the bull path. Azure below 33% with capex still climbing validates the bear path. Everything else — Copilot seat counts, quantum milestones, headline EPS beats flattered by investment gains — is secondary to those two numbers printed side by side.
Frequently asked questions
Why did Microsoft stock fall in early 2026 and recover in July?
The stock fell 9.99% on 29 January 2026 on concern that AI capital expenditure was outpacing the revenue it generated, and bottomed near $353. It rose 15.51% on 30 July 2026 when fourth-quarter results showed Azure accelerating to 43% growth, capex slightly below expectations at about $41bn, and free cash flow 46% ahead of consensus.
How much is Microsoft spending on AI infrastructure?
Additions to property and equipment totalled $115.9bn in fiscal 2026, against $64.6bn in fiscal 2025 and $44.5bn in fiscal 2024 — an increase of 79.6% in one year and roughly 2.6 times over two. That is about 34.9% of total revenue.
What is Microsoft’s remaining performance obligation?
Commercial RPO — contracted revenue not yet recognised — rose 84% to $678bn in fiscal 2026, roughly two times annual revenue. It is the strongest single data point in the bull case because it represents demand already signed rather than forecast.
Is Microsoft’s EPS growth as strong as it looks?
Not quite. GAAP diluted EPS rose 32% to $17.95, but adjusted diluted EPS rose 22% to $17.28. The adjusted figure excludes net gains from investments, which were large in a year when equity and other investments rose from $15.4bn to $36.3bn. The 22% figure is the better basis for valuation.
What multiple does Microsoft trade on?
About 28.7 times trailing adjusted earnings at $495.40, giving a market capitalisation near $3.68trn on 7.43bn shares. The dividend yield is roughly 0.7%.
What should investors watch next?
Two numbers in the same table: the Azure growth rate and quarterly capital expenditure. Sustained Azure growth with decelerating capex growth is the bull path; decelerating Azure with rising capex is the bear path.
Related reading on FinanceFeeds: our longer-horizon Microsoft forecast for 2026, 2027 and 2030 covers the multi-year view, while the Boston Scientific bull and bear case and the Applied Optoelectronics analysis apply the same scenario framework elsewhere.
Sources: Microsoft Form 10-K for the fiscal year ended 30 June 2026, filed with the SEC on 29 July 2026; fourth-quarter fiscal 2026 results announced 29 July 2026; price data from stockanalysis.com as at the 14 August 2026 close; analyst consensus per published price targets.
This article is analysis, not investment advice. The bull and bear figures are scenarios constructed from published filings and company disclosures, not price targets or recommendations. Readers should conduct their own research before making investment decisions.